User Operations Suite is an internal platform designed to streamline user management and operational targeting by integrating real-time analytics, flexible tagging, and RFM-based segmentation. It empowers operations teams to monitor user behavior, identify key segments, and configure precision campaigns.
The User Operations Suite was developed as an internal platform to address challenges in user management and operational efficiency.
Previously, fragmented data and limited insights made it difficult for teams to reach target users effectively, resulting in low engagement and inefficient resource use.
To solve this, the Suite introduced data-driven precision into user operations. By integrating real-time analytics, segmentation, and flexible tagging, it helps teams improve efficiency, enable personalized targeting, and maximize user value through smarter, evidence-based decisions.
I led the design of the User Analytics Dashboard and User Tagging System, defining core metrics and data structures for FinBridge’s internal operations tool.
- Collaborated with the operations team to translate business goals into measurable KPIs
- Designed interactive dashboards and tagging interfaces for data-driven campaign management
- Applied RFM segmentation to enable targeted retention and personalized engagement
These tools helped the operations team make faster, more informed decisions and improved the precision of marketing campaigns.
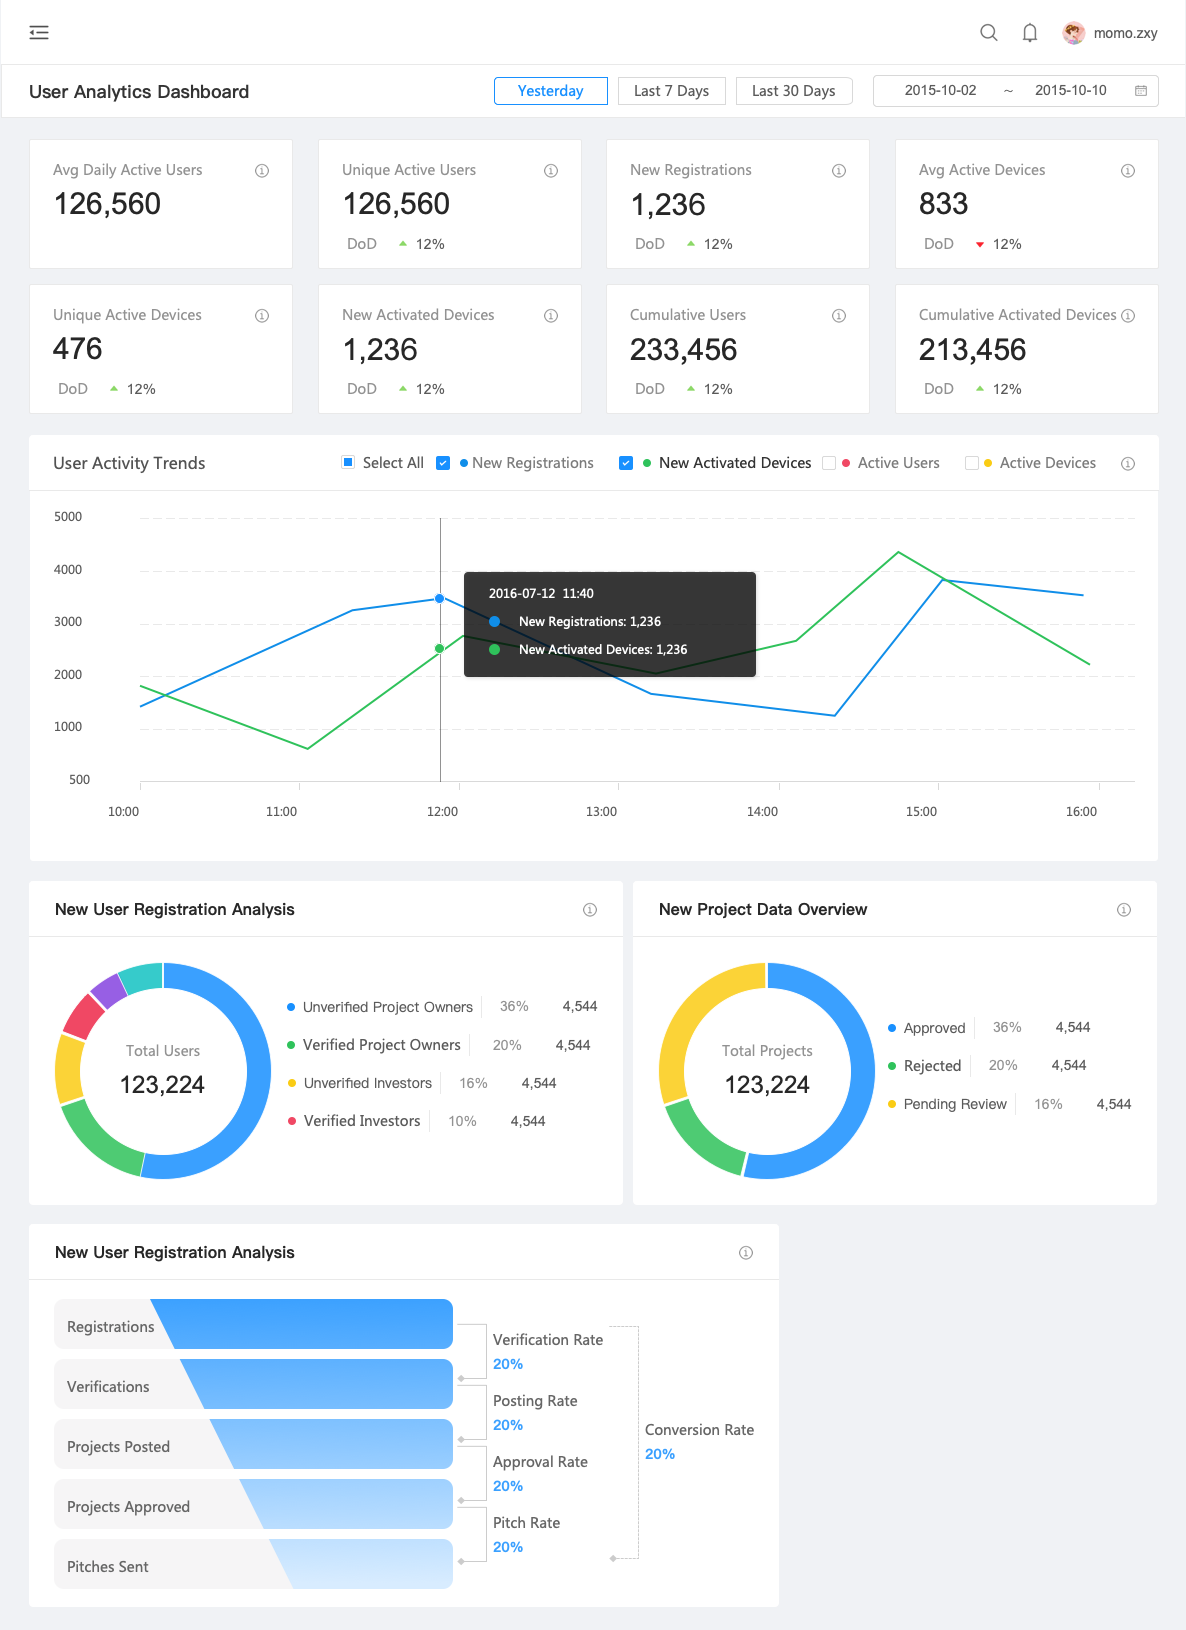
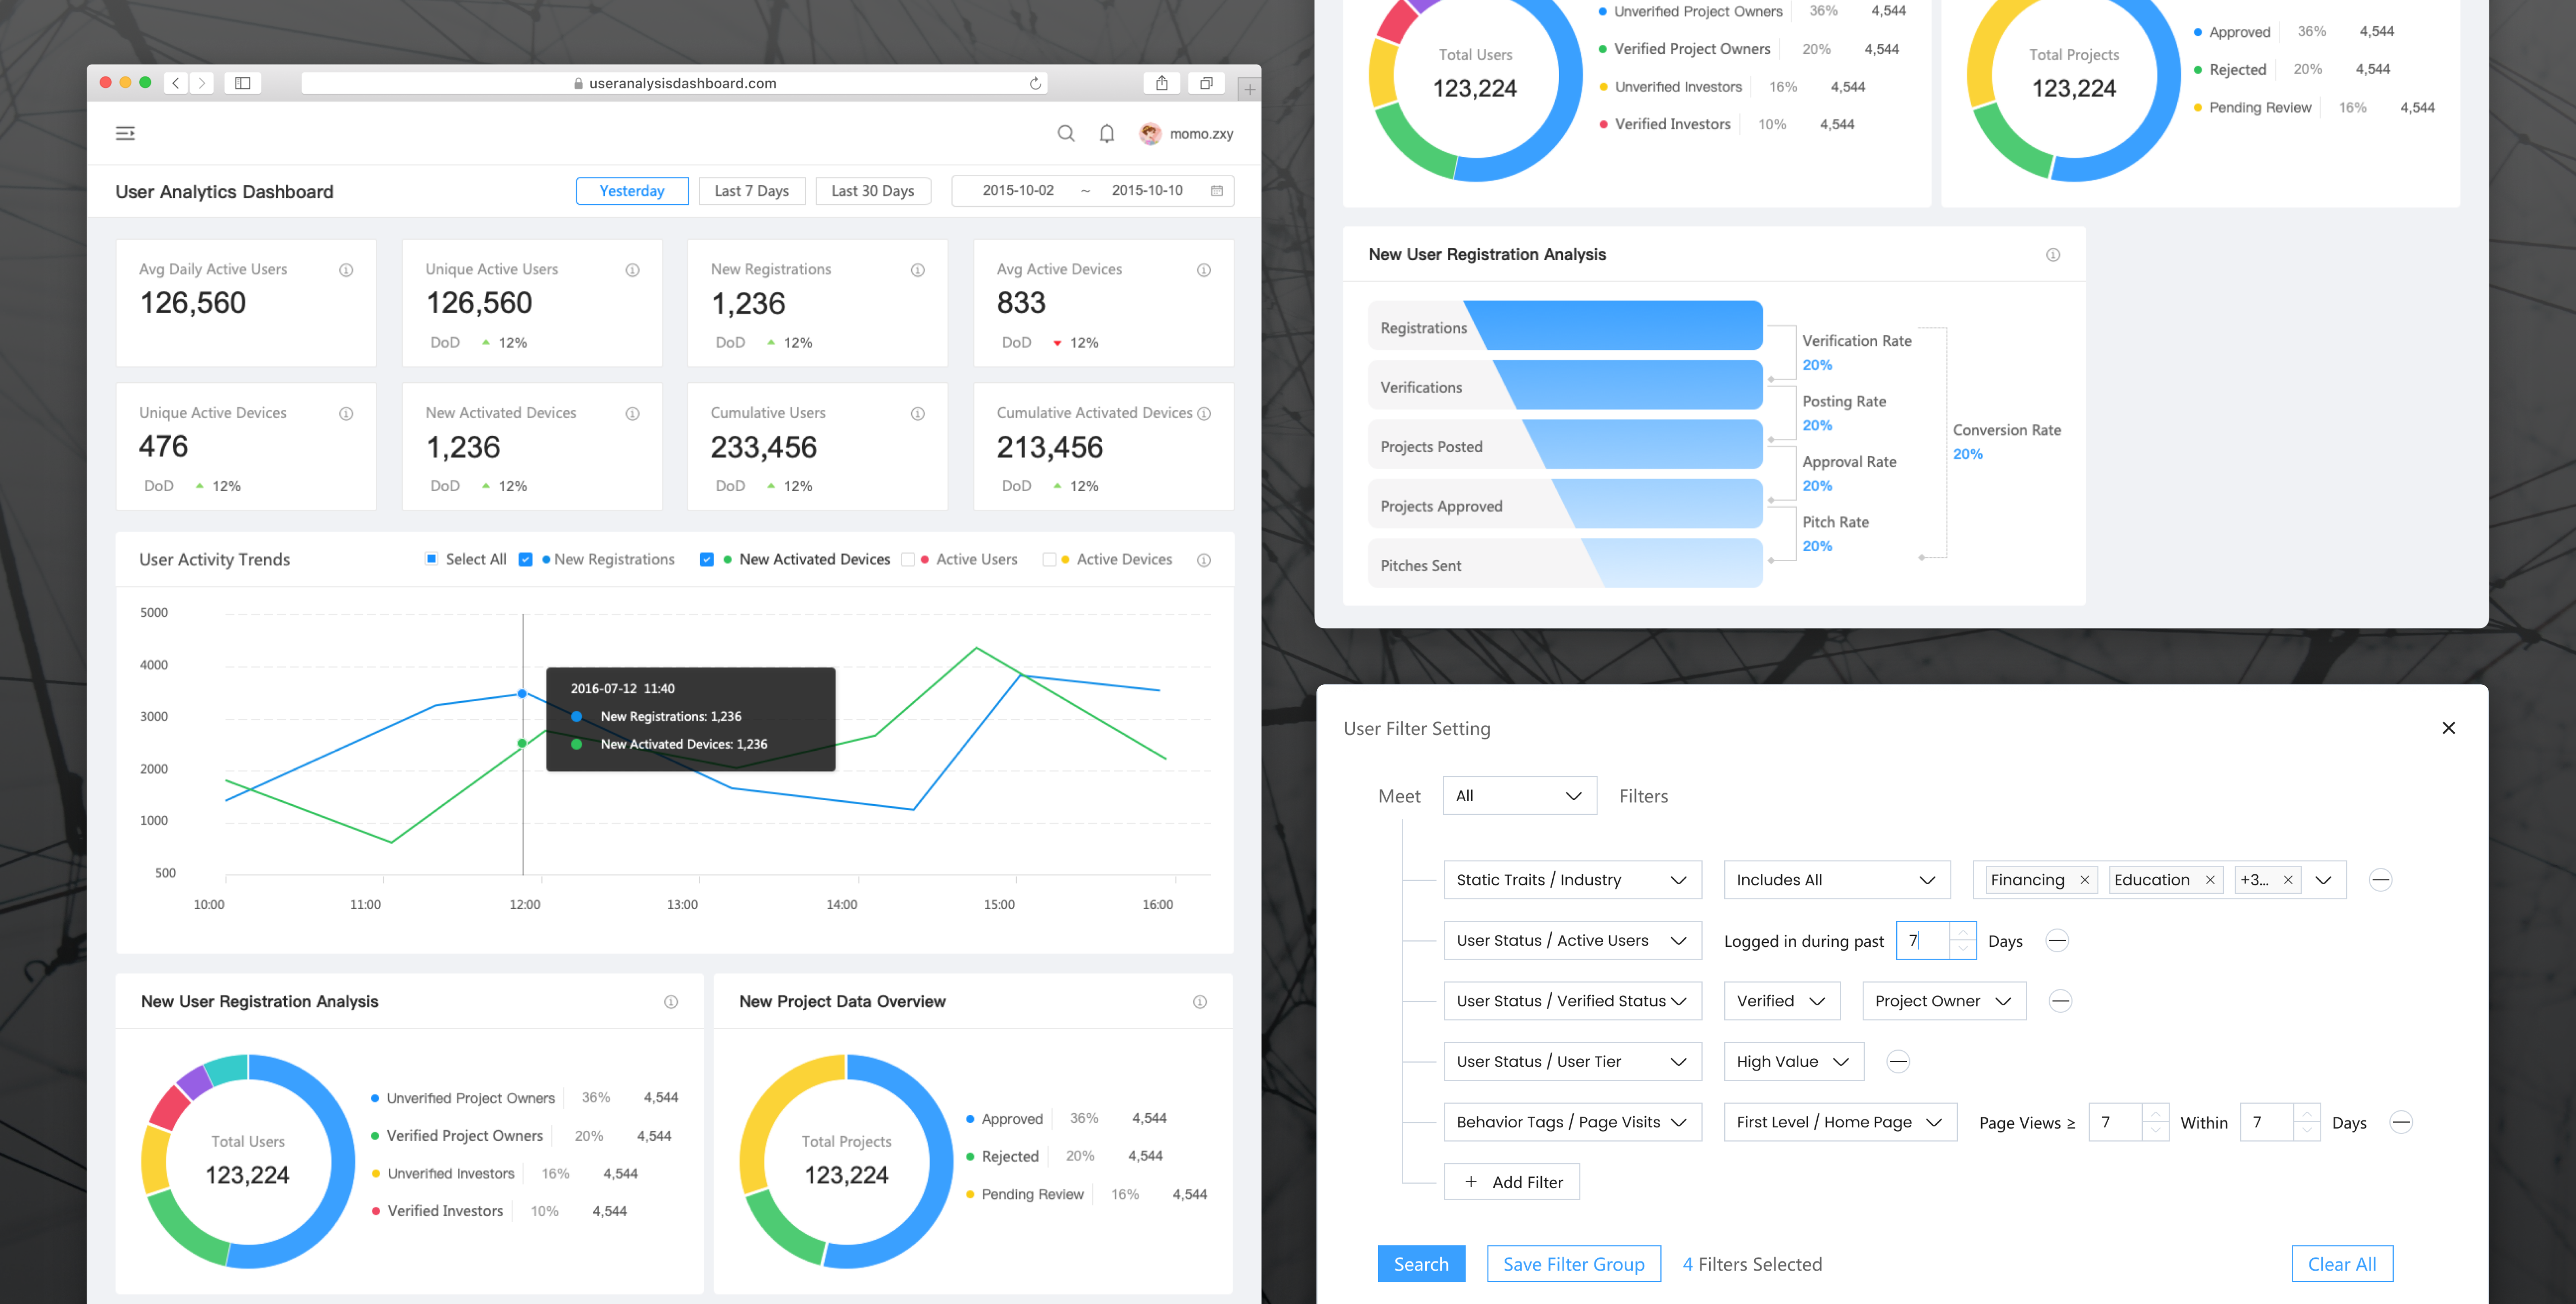
A centralized, interactive view of platform performance, designed to track both high-level KPIs and detailed user activity patterns.
Core KPIs: Key metrics including Daily Active Users (DAU), Unique Devices, New Registrations, and Cumulative Users, with day-over-day growth rates.
Trend Analysis: Line chart tracking new registrations, device activations, and active users over time for performance monitoring.
User & Project Composition: Pie charts showing user types (verified/unverified, project owners/investors) and project status distribution (approved, rejected, pending).
Funnel Metrics: Step-by-step conversion tracking from registration to project pitching, highlighting verification, posting, approval, and pitch rates.
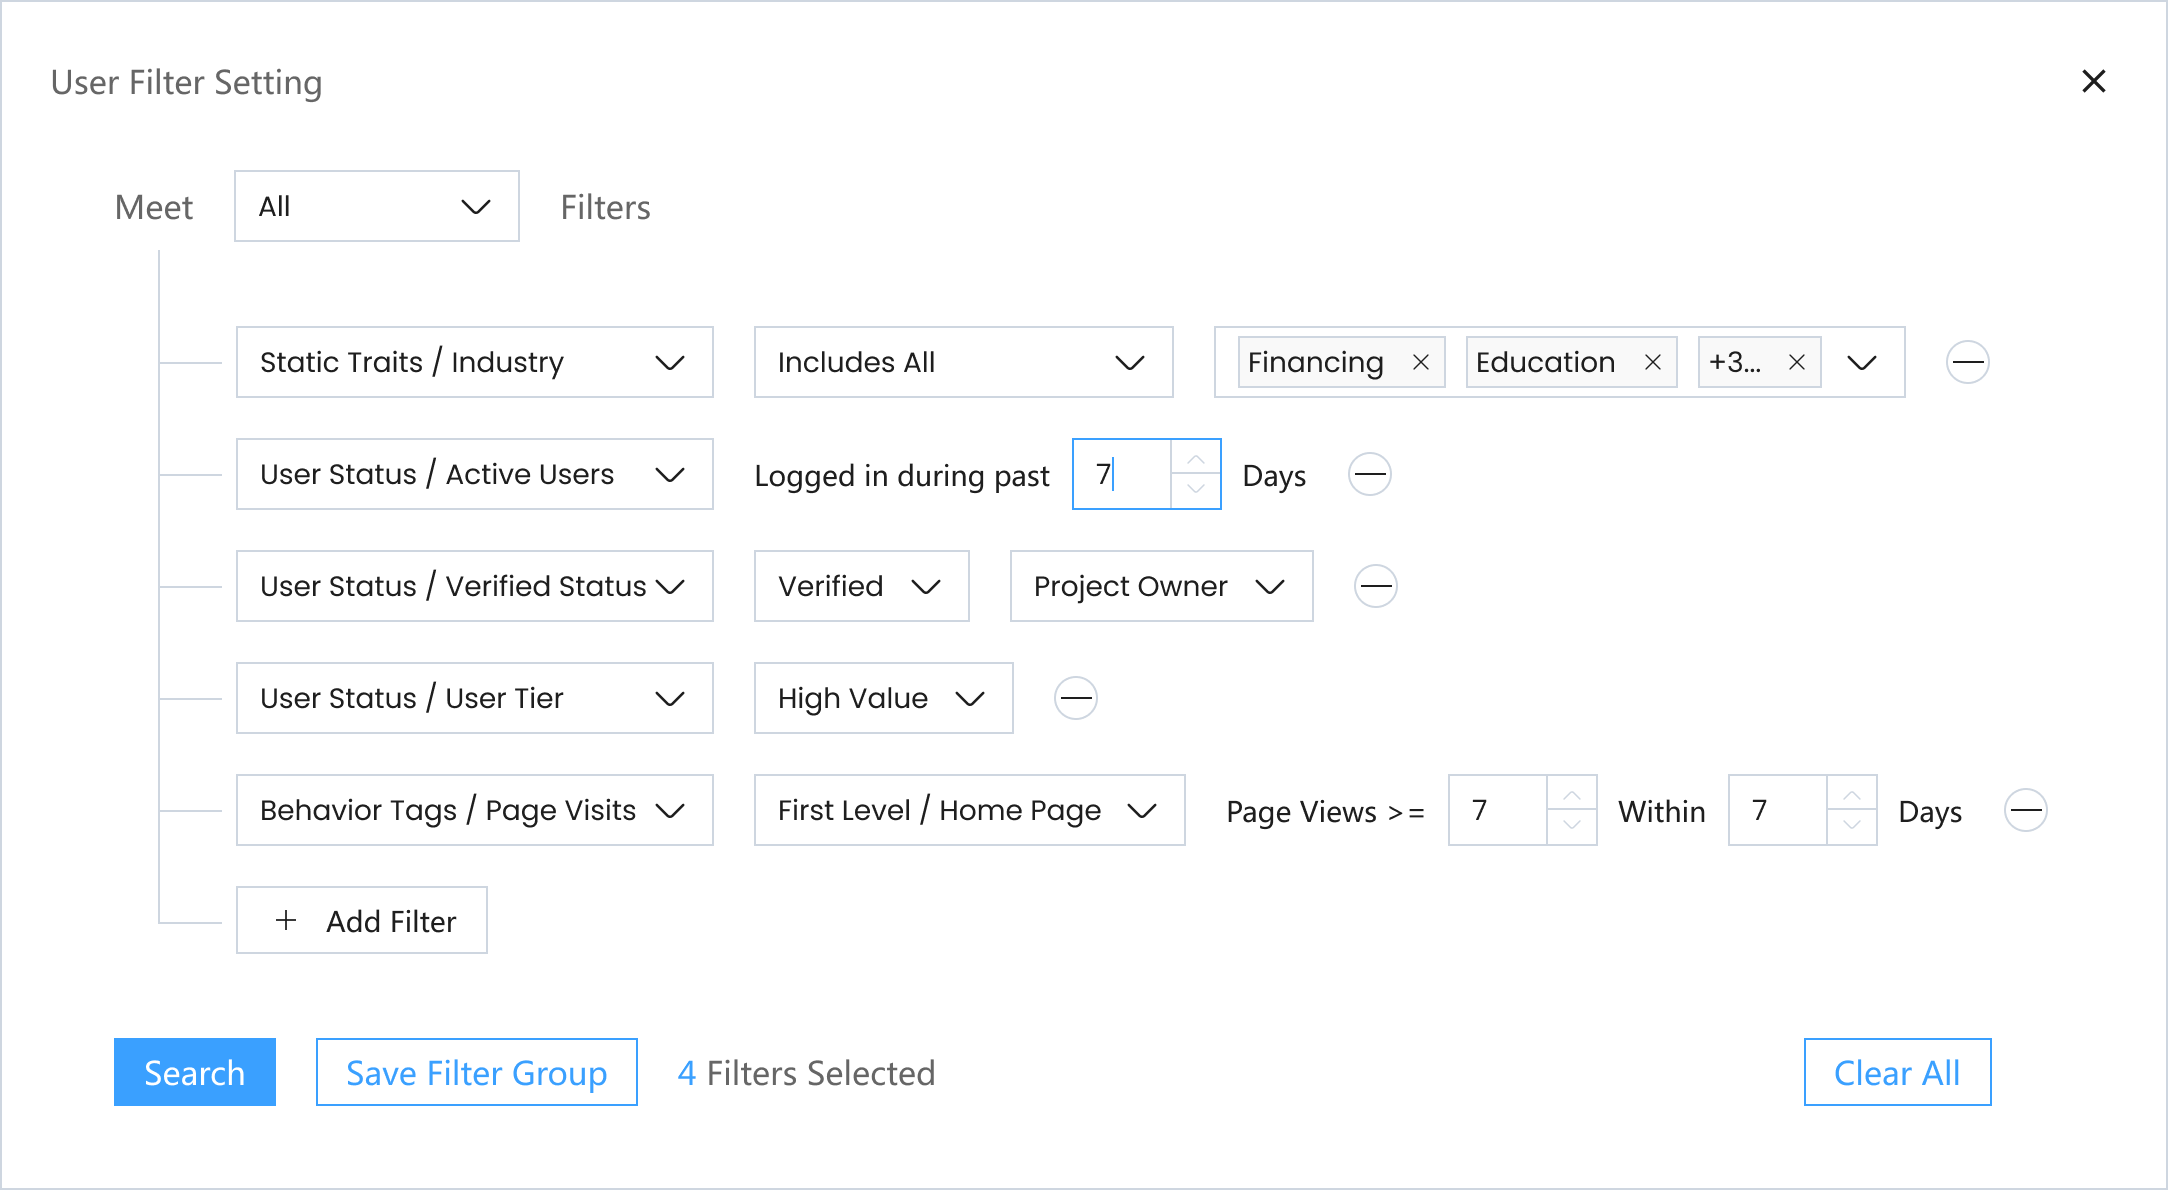
A unified framework for classifying users by static attributes and dynamic behaviors, enabling RFM-based segmentation and powering advanced targeting in operational campaigns.
Static & Dynamic Tags: Covers immutable attributes such as gender, age, location, industry, and device type, as well as dynamic behavioral labels like login frequency, purchase history, browsing patterns, and engagement depth.
RFM Segmentation: Classifies users based on Recency, Frequency, and Monetary value to identify high-value, at-risk, and inactive segments, enabling targeted retention and monetization strategies.
Advanced User Filter: allowing operations teams to combine tag-based criteria, such as user tier, verification status, and behavioral triggers, for precise targeting in campaign setup and delivery.
Working on the User Operations Suite was a turning point in how I approached product design within a data-driven environment.
Operational Perspective: Learned to think beyond interface design, focusing on how data structures, tagging rules, and segmentation models translate into actionable growth levers.
Data-Driven Decision Making: Developed the ability to design with metrics in mind, ensuring that dashboards and filters deliver insights that can be immediately acted upon.